


Im Verzeichnis Programme\SigmaPlot\SPW13\Samples\Sample Graphs finden Sie die Notebooks mit diesen Beispielgraphen (Help-Menü > "SigmaPlot Examples").


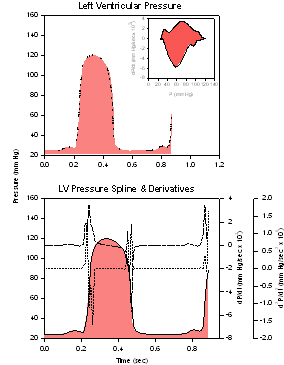
Ventricular Pressure
Graph 1, Left Ventricular Pressure
- Plot 1: Simple Area, XY Pair
Graph 2, LV Pressure Spline & Derivatives
- Plot 2: Simple Area, XY Pair
- Plot 3: Simple Straight Line, XY Pair
- Plot 4: Simple Straight Line, XY Pair
Graph 3
- Plot 5: Simple Spline Curve, XY Pair
(Ventricular Pressure.JNB)
Concentration-Inhibition
Plot 1: Simple Spline Curve, XY Pair
Plot 6: Simple Spline Curve, XY Pair
Plot 9: Simple Spline Curve, XY Pair
Plot 8: Simple Spline Curve, XY Pair (Hidden)
Plot 1: Multiple Scatter, X Many Y
(Concentration-Inhibition.JNB)
Climograph (in color)
Plot 1: Multiple Area, X Many Y
Plot 2: Simple Bar, XY Pair
(Climograph.JNB)
Polar Bubble Plot
Plot 1: Scatter, Theta R (Hidden)
Plot 2: Scatter, Theta R
Plot 3: Lines, Theta R
(Polar Bubble Plot.JNB)
Error Bars
Plot 1: Multiple Error Bars, X Many Y
Plot 2: Multiple Error Bars, X Many Y
(Error Bars.JNB)
World Population Timeline
Plot type: Grouped Error Bars
Data format: X, Many Y Replicates
(World Population.JNB)
Piper Plot
4 Graphs
Graph 1: Scatter, Ternary Triplets
Graph 2: Scatter, Ternary Triplets
Graph 3: Scatter, Ternary Triplets
Graph 4: 12 * Simple Scatter, XY Pair
(Piper Plot.JNB)
Error Bars
Plot type: Grouped Error Bars
Data format: Y, Many X Replicates
(Bar Chart.JNB)
Coral Reef 2D
Graph 1: Multiple Straight Lines, X Many Y
Graph 2: 2 * Horizontal Error Bars, Y Many X
Graph 3
- Plot 1: Bi-directional Error Bars, XY Pairs
- Plot 2: Horizontal Error Bars, Y Many X
(Coral Reef.JNB)
Vector Field Plus Contour
Graph 1: Filled Contour Plot, XYZ Triplet
Graph 2: Vector plot XYAM
(Vector Plot.JNB)
Motor Armature
1 Graph
9 Plots
(Motor Armature.JNB)
Ring Graph
Graph 1
- Plot 1: Pie Chart, Single Column
Graph 2 :
- Plot 1: Stacked Bars, Many Y
(Ring Graph.JNB)
Stacked Area Plot
Plot type: Multiple Area
Data format: X Many Y
(Stacked Area Plot.JNB)
Stacked Bar Chart
Plot 1: Stacked Bars, X Many Y
Plot 2: Stacked Bars, X Many Y
(Stacked Bar Chart.JNB)
Stock Chart
Graph 1
- Plot 1: Simple Error Bars, X, Many Y Replicates
Graph 2 :
- Plot 1: Simple Bar, XY Pair
(Stock Chart.JNB)
Floating Bars
- Plot 1: Grouped Bar, X Many Y
- Plot 2: Grouped Bar, X Many Y
(Floating Bars.JNB)
Big Impact
Plot 1: Simple Regression, XY Pair
Data format: Simple Scatter, Single Y
(Big Impact.JNB)
Big Impact
Color Contour Graph
Plot type: Filled Contour Plot
Data format: XYZ Triplet
(Star.JNB)
Gradient
Plot 1 (Hidden): Multiple Area, X Many Y
Plot 2: Simple Straight Line, XY Pair
Plot 3: Simple Straight Line, XY Pair
Plot 4: Simple Straight Line, XY Pair
Plot 5: Simple Bar, XY Pair
(Gradient.JNB)
Multivariate
6 Graphs, each with
- Plot 1: Simple Bar, Single Y
- Plot 2: Simple Bar, XY Pair
- Plot 3: Simple Bar, XY Pair
(Multivariate.JNB)
Survival
- Plot 1: Multiple Straight Lines, XY Pairs
- Plot 2: Multiple Scatter, XY Pairs
(Survival.JNB)
Bars
- Plot 1: Simple Error Bars, X Many Y
- Plot 2: X Many Y, X Many Y
(Bars.JNB)
Histograms
- Graph 1: Simple Bar Plot, Single Y
- Graph 2: Simple Bar Plot, Single Y
(Histograms.JNB)
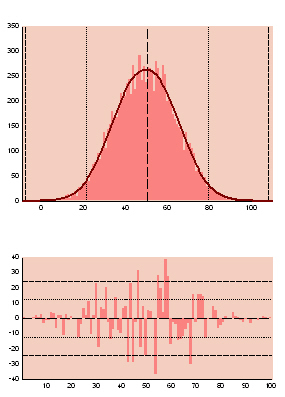
Color Histogram and Residuals
Graph 1
- Plot 1: Simple Bar Plot, Single Y
- Plot : Simple Straight Line, XY Pair
Graph 2
- Plot 1: Simple Bar Plot, Single Y
(Histogram&Res.JNB)
Bell: Intersecting bell curves
Plot type: Complex Area
Data format : XY Pairs
(Bell.JNB)
Frequency Plot
Plot type: Multiple Scatter
Data format : XY Pairs
(Frequency.JNB)
(-> Frequency Plot macro)
(-> Dot Density Plot macro)
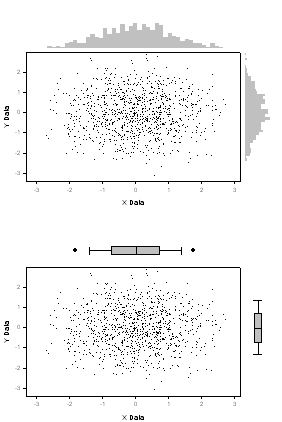
Border Plots
Border Plots, Histogram
Graph 1: Simple Scatter, XY Pair
Graph 2: Simple Bar, Single Y
Graph 3: Simple Bar, Single X
Border Plots, BoxPlot
Graph 1: Simple Scatter, XY Pair
Graph 2: Horizontal Box Plot, Many X
Graph 3: Vertical Box Plot, Many Y
(Border Plots.JNB)
(-> Border Plots macro)
Box Plot
- Plot 1: Simple Error Bars, X Many Y
- Plot 2: X Many Y, X Many Y
(Box Plot.JNB)
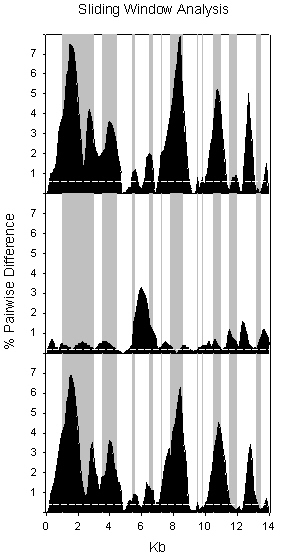
Sliding Window Analysis
3 Graphs, each with
- Plot 1 (window): Simple Area, XY Pair
- Plot 1 (pct change): Simple Area, XY Pair
(Sliding Window Analysis.JNB)
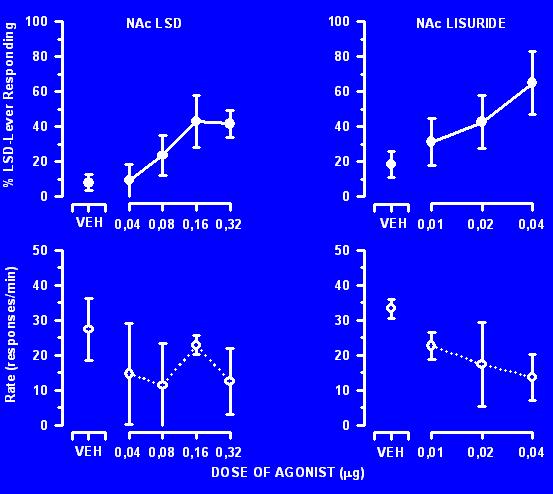
Error Bar Plot with Curve Fits
Plot 1: Multiple Error Bars, XY Pair
Plot 2: Multiple Spline Curves, X Many Y
(slide1.JNB)
4 x 2 Graphs
Plot Type: Simple Error Bars, XY Pair
(slide3.JNB)
Notebooks mit Beispielgraphen im Verzeichnis Programme\SigmaPlot\SPW13\Samples\Sample Graphs:


