Systat Software Tech Bulletin | ||
|
October 2016 |
||
|
||
In this edition: | ||
Systat Software Presents: "SigmaPlot 13, A few clicks from data to presentation" Join our free Online-Seminar 19th October 2016, 11:00 Reminder: All users of SigmaPlot 12.0-12.3 are encouraged to install the free update to 12.5. Also, users of SigmaPlot 13 should install the hotfix. Both are available here: systatsoftware.com/products/sigmaplot/sigmaplot-product-updates/ |
||
|
|
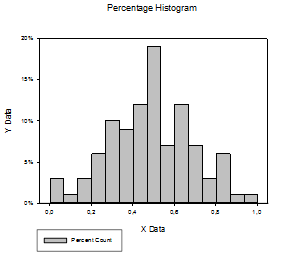
The Column Statistics Window SigmaPlot automatically calculates a number of basic statistical values for all the data in your worksheet. and displays them in the Column Statistics. These values are updated whenever you change a value in your data worksheet. [PDF]Percentage Histogram How do I calculate a histogram of raw data based on the percent of total? Here is an example that generates the percentages from the raw data with a user-defined transform.
Percentile Methods When graphing error bars and creating box plots, you can select the method of computing percentiles.
TechTips topics? If you would like to see TechTips about certain topics please let us know. |
|
Should you wish no further mailing from us, please forward this mail to kontakt@systat.de with the subject
"Unsubscribe [Email]".
| Systat Software GmbH - Tel.: 0 2104 9540 - Email: kontakt@systat.de |