Systat Software Tech Bulletin | ||
|
March 2015 |
|
|
|
In this edition: | |
|
Systat Software Online-Seminar
|
|
|
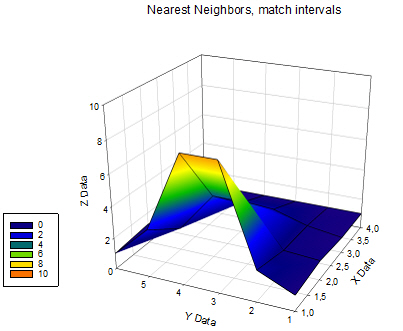
Interpolation issues with Mesh and Contour graphs When SigmaPlot graphs a mesh or contour graph, if the X and Y data forms a regular matrix, the graphs are usually as expected. When the X and Y values are not so spaced, SigmaPlot interpolates values, and can give unexpected results. This article covers other options for generating data for these graphs.
You can rearrange the order of notebook items by dragging them with the mouse: worksheets, graph pages etc., and also sections. [PDF]
The Publication Assistant checks if your graph matches the requirements of the journal or other media where you want to publish your research. [PDF]
|
Should you wish no further mailing from us, please forward this mail to kontakt@systat.de with the subject
"Unsubscribe [Email]".
| Systat Software GmbH - Tel.: 0 2104 9540 - Email: kontakt@systat.de |