Systat Software Tech Bulletin | ||
|
January 2014 |
|
|
|
In this edition: | |
|
Systat Software Online-Seminar
|
|
|
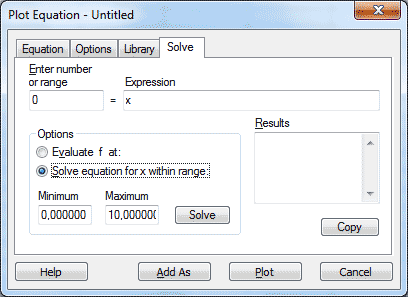
Plot and Solve Equations With SigmaPlot's equation plotter and solver, you can
You can use equations from the built-in equation library, or you can add you own equations.
You can also write the results to the worksheet.
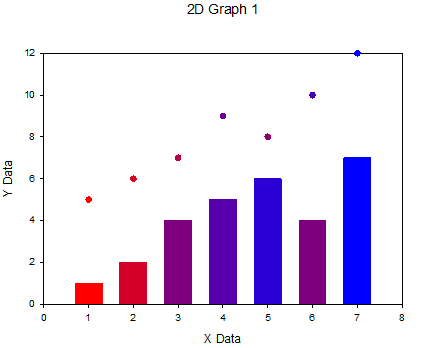
This macro creates a column of colors changing smoothly in colors as the data changes from its minimum value to its maximum value and employs this gradient to color e.g. the symbols in a scatter plot.
|
Should you wish no further mailing from us, please forward this mail to kontakt@systat.de with the subject
"Unsubscribe [Email]".
| Systat Software GmbH - Tel.: 0 2104 9540 - Email: kontakt@systat.de |